Project management involves a lot of multi-tasking. Matching deadlines and sticking to the schedule while overcoming unforeseen roadblocks seems like a herculean task for a person handling multiple teams! So how does one become more efficient while shifting between several tasks and making the best out of their time concerning multiple projects? This is where the Gantt chart steps in to take the reins and make life easier for a manager. You can create a Gantt chart in Excel using an automated excel template like Gantt Chart Excel. This template allows you to plan your projects and create beautiful looking timelines in no time. The template is based on excel and it is easy to use as excel is familiar to everyone in the project team.
It is said that visual representation and overview has a better impact on the one keeping track of multiple projects at once. Now imagine a place where all your projects are lined up according to priority, deadlines, and resources along with a real-time tracker of its progress? This is exactly what a Gantt chart does for you.
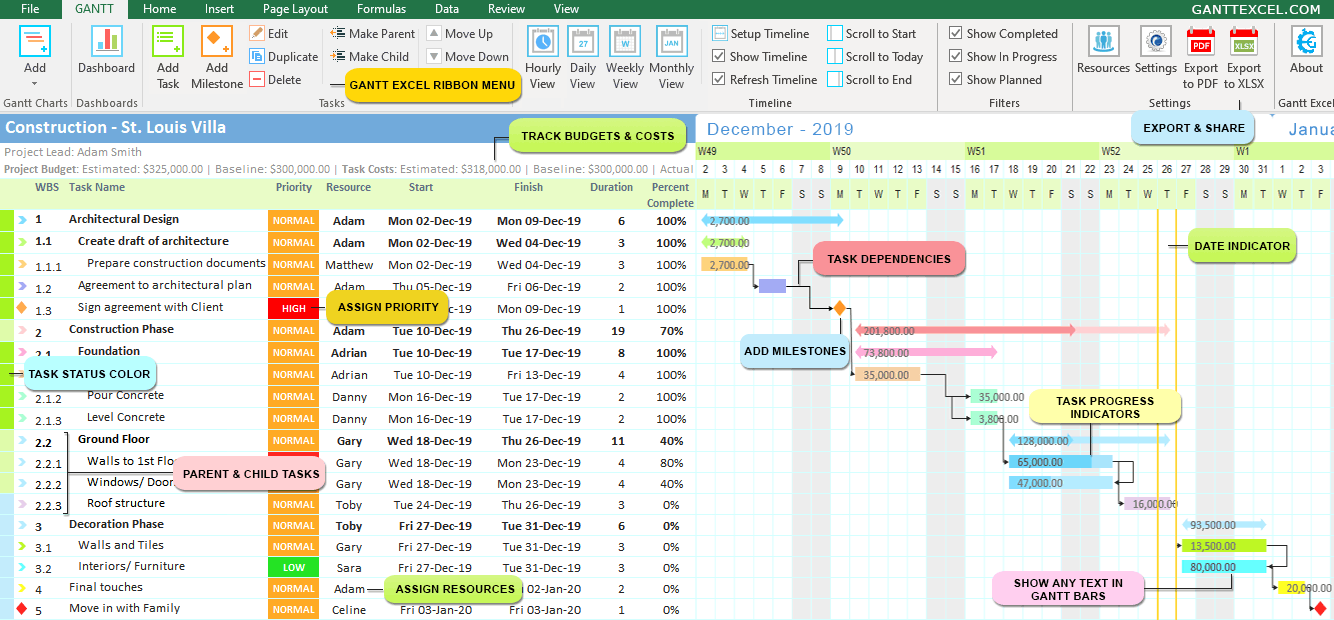
What is a Gantt chart?
According to the Economic Times, “A Gantt chart is a useful graphical tool which shows activities or tasks performed against time. It is also known as the visual presentation of a project where the activities are broken down and displayed on a chart which makes it is easy to understand and interpret.”
In layman terms, a Gantt chart is a visual presentation of activities marked against time in the form of bars. A Gantt chart includes information such as the deadline of the project, who has it been assigned to, overlapping schedules and activities etc. In short, the Gantt chart clears the clutter and confusion to formulate a solid course of action for several tasks at hand at a single glance.
Benefits of Gantt Charts
Following are 10 benefits of using Gantt charts in project management:
Coordination: Resource schedulers and project managers, sequencing events becomes an important benefit that helps them not to overburden team members working on multiple tasks at hand. They can also use the Gantt chart to create a cycle of breaking down huge assignments into smaller tasks to avoid burnout and monotony among members.
Communication: Real-time sharing of statuses through the Gantt chart can replace overusing meetings in an organization by just updating chart positions as the tasks proceeds. Team members working on multiple projects can easily keep track and communicate with all the teams from remote locations as well.
Motivation: Team members become more fired-up to complete the task at hand when given an external source of motivation. Goal setting and achieving them on time gives a boost to team morale and encourages everyone to do their best.
Efficiency: A team member can leverage their deadlines better while waiting to start on other projects. Instead of sitting idle, they could use the time to finish their part in a different project while the others are on standby.
Documenting Highs and Lows: Gantt charts shed light on both achievements and shortcomings by documenting the effort and outcomes of projects. It provides an opportunity for the organization to provide feedback to teams that faltered and reward the teams that surpassed expectations and went over and beyond.
Time Management: Scheduling helps the teams understand the impact of minor delays in the long run when it comes to the project. This helps managers and team members become better at using their time in a judicious manner.
Clarity: When all the tasks are assigned, resources are noted and plans are placed in a visual graph, anyone can easily understand multiple timelines with crystal clarity without any room for confusion or chaos.
Flexibility: The Gantt chart provides a window for contingencies in the original plan so the manager can improvise as they go if the need arises. Delays in the schedule and other complications can be swiftly handled to control the damage and keep the parallel projects running smoothly.
Manageability: By externalizing their assignments during crucial projects, managers can get an eagle’s eye view of all the pieces to make informed and efficient decisions.
Creativity: To keep their creative juices flowing, project managers can use the Gantt chart to divide long term projects into lighter sets of tasks. The teams can easily juggle in between tasks to have a fresh perspective every now and then.
Gantt Excel Template is completely automated and is super easy to use. If you use Microsoft Excel, you can create a Gantt Chart with almost no learning curve by downloading Gantt Excel. Microsoft Excel is instantly familiar, so everyone on your team “gets it” and hits the ground running.